
Introduction
I’m currently using the Oneplus 8. To prolong its battery life, I’m trying to keep the charge between 40 and 80%. This was inspired by the research done by BatteryUniversity. It seemed pretty intuitive to me that you’d want the charge around 50% as that would be the most stable situation.
However for the Oneplus 8 this is not very trivial, as the phone charges with 30 watts. If I would just plug it in and forget about it for a few minutes, it’s already at 100%. For that reason, I started collecting charge data to be able to predict the amount of time it takes to get to 80%.
The system is as simple as I could imagine (I’m lazy): an Android Kotlin frontend app which you start before charging. This app then pings the current percentage via UDP to a server. This server (written in Rust, wohoo!) then collects the data and notifies me whenever I need to disconnect the charger. Using the collected data, the server can also predict how long the phone needs to stay connected. This post is about the collected data, not about the software.
Data collected
I stored the start and end battery percentages, as well as the charging time in seconds. At the moment of writing I have collected 127 samples over the span of about 9 months, meaning just shy of 0.5 samples per day. The raw CSV is available here.
Model
Like a proper physicist, I just modelled the charge-time relationship as being linear, i.e.
\[
T = a \Delta C + b
\]
with \(C\) the starting battery percentage, \(\Delta C \equiv 80\% – C\) the amount to be charged, \(T\) the time in minutes and \(a,b\) two coefficients. If you would like to use the data manually (e.g. printed on your door), it’s easier to use the following model:
\[
T = a’ C + b’
\]
where instead the time it takes to reach 80% is modelled.
Data analysis
The data can be analysed using some simple linear regression, I used scipy’s linregress. Because the percentage reported by Android is an integer, there only exists data at integer percentages. I’m not sure about the effect this has on regular linear regression or if this requires any special treatment. I will just ignore it in the following analysis.
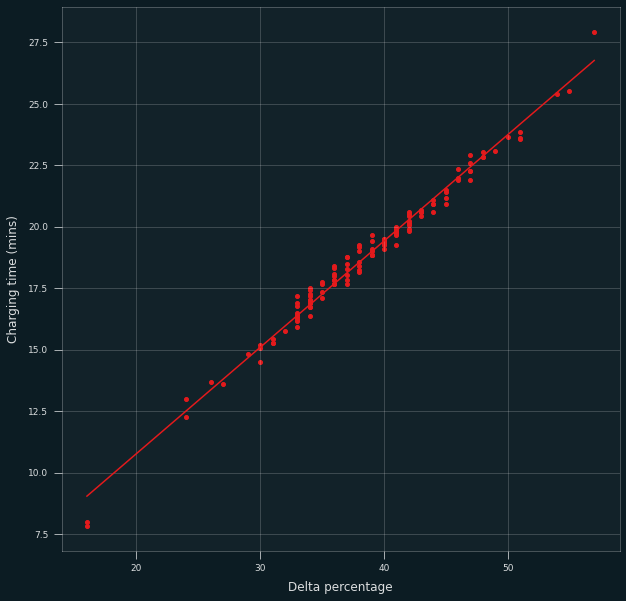
For the first model, the resulting parameters are:
| Variable | Value |
|---|---|
| Slope (\(a\)) | 0.4322 |
| Intercept (\(b\)) | 2.1271 |
| \(R^2\) | 0.985 |
The R-squared parameter is pretty close to 1, meaning the fit is quite good. Of course this can easily be seen from the data itself:
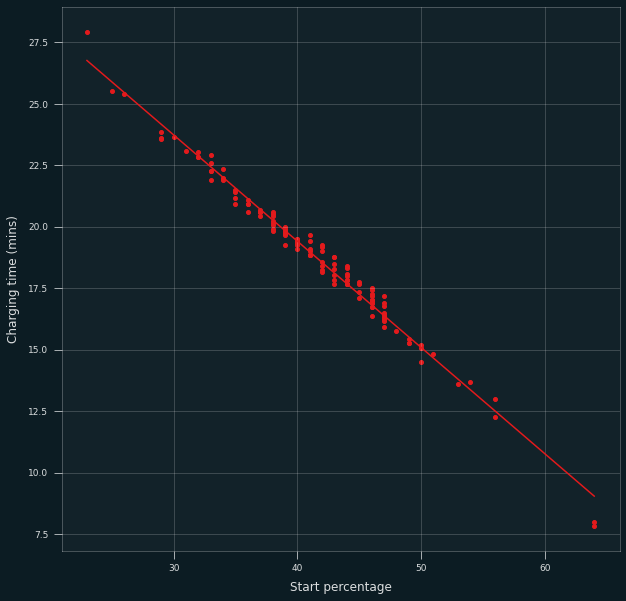
The alternative (“inverted”) model is similar:
| Variable | Value |
|---|---|
| Slope (\(a’\)) | -0.4322 |
| Intercept (\(b’\)) | 36.701 |
| \(R^2\) | 0.985 |
 Hopefully this data helps someone take care of their battery and extend the lifetime of their device!
(Plot theme: https://github.com/quantumblacklabs/qbstyles)